Electric Car Running Costs vs Petrol: Full Cost Comparison 2026
The question of electric car running costs vs petrol does not have a single answer. It depends entirely on how you charge, how many miles you drive, and which costs you include.
Home charging makes electric cars meaningfully cheaper to run per mile.Public rapid charging can make them more expensive than petrol. This guide breaks down every cost category so you can calculate which is cheaper for your specific situation.
Use our EV vs petrol calculator to enter your own mileage, electricity price, and fuel price and get a personalised comparison in under 60 seconds.
Reviewed by the FuelConsumptionCalc Editorial Team.
Sources: Consumer Reports June 2026, The Electric Car Scheme June 2026,
Cap HPI via Carwow June 2026, Leasing.com EV Guide 2026, Right Fuel Card
April 2026, AAA Your Driving Costs 2025, IRS EV Tax Credit Guidance 2026,
U.S. Energy Information Administration June 2026.
Last Updated: July 2026.
Quick Answer
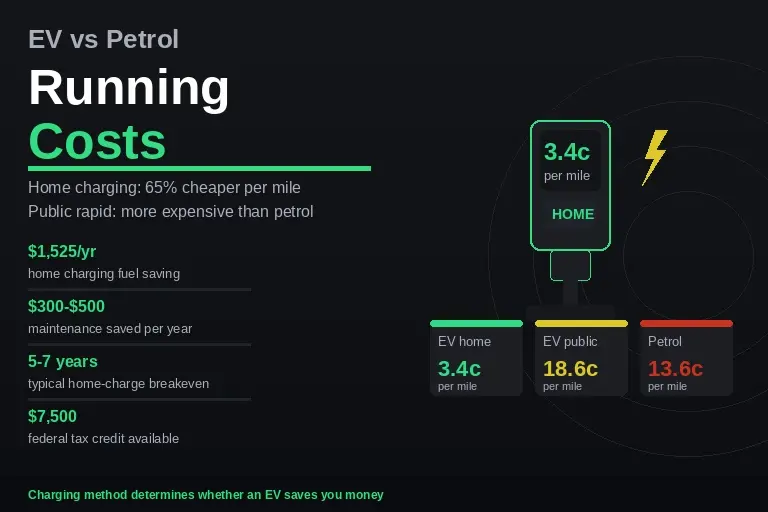
At home charging rates of 12 cents per kWh, an EV costs 3 to 5 cents per mile to run on electricity. At $4.07 per gallon and 30 MPG, a petrol car costs 13.6 cents per mile. Home charging wins by a wide margin. At public rapid charging rates of 50 to 80 cents per kWh, the EV costs 15 to 24 cents per mile, more expensive than petrol. Charging method is the single biggest factor in EV running costs.
Fuel Savings by Strategy
| Cost Category | Electric Car (EV) | Petrol Car |
| Fuel/Charging per mile | 3-5c (home) / 15-24c (rapid) | 13-18c |
| Annual fuel cost | $490-$780 (home) | $2,040-$2,700 |
| Maintenance per year | $800-$1,000 | $1,200-$1,500 |
| Insurance per year | 5-15% higher | Baseline |
| Depreciation (3yr) | 50-54% of value | 38-41% of value |
| Road tax/registration | Varies by state | Varies by state |
*Based on 15,000 miles/year, 30 MPG petrol, home charging at $0.12/kWh, $4.07/gal petrol, EPA-rated efficiency for mid-size EVs.
[EXPERT CALLOUT]
“Electric vehicles cost 65% less per mile to run than petrol cars when charging at home, with drivers saving $600 to $1,500 annually on fuel alone.”
- The Electric Car Scheme, June 2026
The Electric Car Scheme, June 2026
1.Fuel vs Charging Costs
Fuel cost is where EVs win most clearly, but only when you charge at home.The cost difference between home charging and public rapid charging is dramatic and changes the entire calculation.
EV Charging Cost Breakdown
The table below shows cost per mile across all charging scenarios using June 2026
electricity prices and a mid-size EV averaging 3.5 miles per kWh.
| Charging Method | Rate per kWh | Cost per Mile | Annual Cost (15k mi) |
| Home standard tariff | $0.12 to $0.16 | 3.4 to 4.6c | $510 to $690 |
| Home off-peak tariff | $0.07 to $0.09 | 2.0 to 2.6c | $300 to $390 |
| Public Level 2 charger | $0.25 to $0.45 | 7.1 to 12.9c | $1,065 to $1,935 |
| Public DC fast charger | $0.45 to $0.65 | 12.9 to 18.6c | $1,935 to $2,790 |
| Public rapid charger | $0.65 to $0.80 | 18.6 to 22.9c | $2,790 to $3,435 |
| Petrol 30 MPG at $4.07 | N/A | 13.6c | $2,040 |
Home charging wins by a clear margin. Public rapid charging costs more than petrol for most EV drivers. The charging method you rely on determines whether
an EV saves you money or costs you more.
Home Charging Cost Per Mile
Home electricity in the US averages around 12 to 16 cents per kWh as of July 2026.
A typical EV uses 3.0 to 4.0 miles per kWh in real-world driving. At 12 cents per kWh and 3.5 miles per kWh, the cost is 3.4 cents per mile.
Charging overnight on off-peak tariffs where available reduces this further
to 2 to 3 cents per mile. Drivers with solar panels can reduce charging costs to near zero for daytime charging.
Public Charging Cost Per Mile
Public Level 2 chargers usually charge 20 to 40 cents per kWh, giving a per-mile cost of 7 to 13 cents. Public DC fast chargers run 40 to 80 cents per kWh, pushing per-mile cost to 12 to 24 cents per mile.
Running an electric vehicle using rapid public chargers costs more than 24 cents per mile, while a comparable diesel vehicle runs at 12.5 cents per mile. Drivers who rely mainly on public rapid charging may pay more per mile than petrol drivers.
Petrol Cost Per Mile
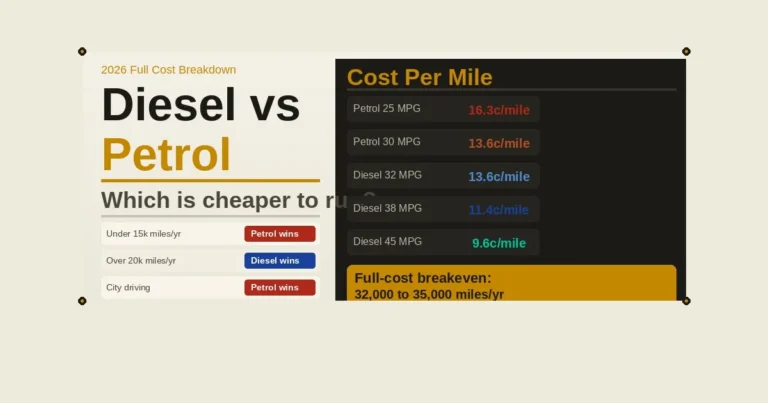
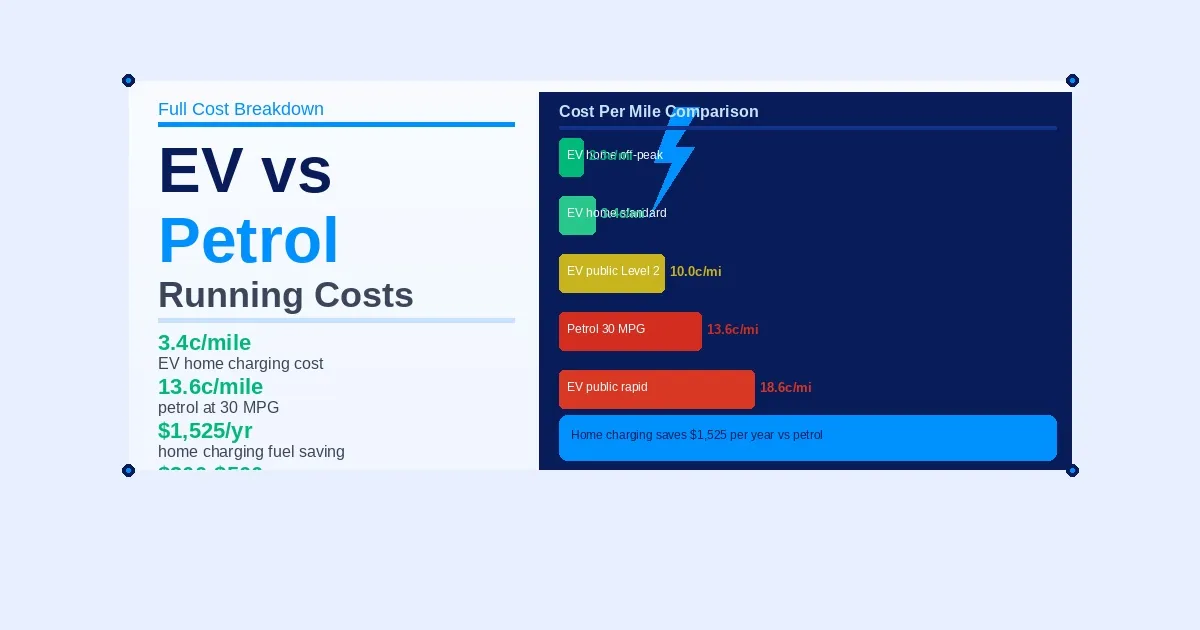
At $4.07 per gallon and 30 MPG, petrol costs 13.6 cents per mile. At 25 MPG it rises to 16.3 cents per mile. At 20 MPG it reaches 20.4 cents per mile.
| Monthly Miles | Cost Per Mile |
| EV – home charging ($0.12/kWh) | 3.4 cents |
| EV – home off-peak ($0.08/kWh) | 2.3 cents |
| EV – public Level 2 ($0.35/kWh) | 10.0 cents |
| EV – public rapid ($0.65/kWh) | 18.6 cents |
| Petrol – 30 MPG at $4.07/gal | 13.6 cents |
| Petrol – 25 MPG at $4.07/gal | 16.3 cents |
| Petrol – 20 MPG at $4.07/gal | 20.4 cents |
For a detailed calculation based on your exact MPG and fuel price, use our fuel cost calculator.
Annual Fuel Cost Comparison
At 15,000 annual miles, the annual fuel costs compare as follows. Home charging EV at 3.4 cents per mile costs $510 per year. Public charging EV at an average of 15 cents per mile costs $2,250 per year. Petrol car at 30 MPG and $4.07 per gallon costs $2,035 per year.
A home-charging EV driver saves roughly $1,525 per year on fuel compared to a 30 MPG petrol car. A public-charging-only EV driver spends roughly $215 more per year than the petrol driver.
2. Maintenance Costs
EVs have 50% lower maintenance expenses, averaging $165 versus $205 annually in UK data, due to fewer moving parts, no oil changes, and reduced brake wear from regenerative braking.
In US terms, EV maintenance runs $800 to $1,000 per year versus $1,200 to $1,500 for a comparable petrol car. The savings come from several sources.
What EVs Do Not Need
No oil changes. A petrol car needs an oil change every 5,000 to 10,000 miles
at $30 to $80 per service. An EV needs none.
No transmission service. EVs use single-speed reduction gearboxes with no
fluid to change.
Fewer brake jobs. Regenerative braking recovers energy while slowing the car,
meaning friction brakes are used far less. Many EV owners report brake pads
lasting twice as long as on equivalent petrol cars.
No spark plugs, timing belts, or fuel filters. These are petrol-specific
service items that do not exist on an EV.
What EVs Do Need
Tyre rotation and replacement. EVs are heavier than petrol equivalents due to battery weight, which accelerates tyre wear. Budget $50 to $80 more per year on tyres than a comparable petrol car.
Cabin air filter. Replaced every 15,000 to 25,000 miles, same as a petrol car. Battery coolant flush. Required every 5 to 7 years on most EVs.
Battery replacement. The largest potential EV cost. Most modern EV batteries are warranted for 8 years or 100,000 miles. Replacement outside warranty runs $5,000 to $20,000 depending on vehicle. This cost rarely occurs within a typical 5 to 7 year ownership period.
Net Annual Maintenance Saving
A typical EV saves $300 to $500 per year on maintenance compared to a petrol car. Over 5 years that is $1,500 to $2,500 in maintenance savings, which contributes meaningfully to offsetting the higher purchase price.
3. Insurance Costs
EV insurance premiums are currently 5 to 15 percent higher than equivalent petrol cars, though this gap is narrowing as more insurers develop EV-specific products.
On a $1,500 annual insurance premium, 10 percent more means $150 extra per year for the EV. The reasons are straightforward.
Why EV Insurance Costs More
Battery replacement cost. A damaged EV battery can cost $10,000 to $20,000
to replace, far above what any petrol car repair would cost. Insurers price this risk into premiums.
Repair costs. EVs require specialist technicians and parts. Repair times are longer and labour costs are higher at most body shops.
Vehicle weight. EVs are heavier than petrol equivalents, causing more damage
in collisions to both the vehicle and third parties.
How to Reduce EV Insurance Cost
Compare quotes specifically for EVs rather than using the same insurer as your petrol car. Some insurers specialise in EVs and price risk more accurately. A telematics policy that tracks safe driving can cut premiums
by 10 to 30 percent.
4.Depreciation
epreciation is the largest hidden cost in EV ownership and the category where petrol cars currently have a clear advantage.
Analysis of Cap HPI data shows the BMW iX1 loses around 54% of its value over three years, compared to a 41% drop for a petrol equivalent. Fast technology change and consumer concern about battery health drive higher depreciation on current EV models.
Why EVs Depreciate Faster
Battery technology improves rapidly. A 2023 EV with 250 miles of range competes against 2026 models with 350 miles of range at similar prices. The older model loses value faster.
Used EV prices are volatile. The EV market is newer and thinner than the petrol used car market, meaning prices fluctuate more.
Range anxiety in the used market. Some buyers avoid older EVs with higher-mileage batteries due to uncertainty about remaining battery capacity.
Depreciation in Practice
On a $45,000 EV that loses 54 percent over 3 years, the depreciation cost is $24,300 over 3 years, or $8,100 per year. On a $32,000 petrol car that loses 41 percent, the depreciation cost is $13,120 over 3 years, or $4,373 per year. The EV loses $3,727 more per year to depreciation in this example.
This depreciation gap is the single biggest reason why total cost of EV ownership often exceeds petrol ownership in the first 3 to 5 years despite lower running costs.
The Used EV Opportunity
Used EVs are currently a bargain as prices are hardening with current market conditions. Used long-range rear-drive BMW i4s are cheaper than four-cylinder petrol 430is.
Buying a 2 to 3 year old EV lets you avoid the steepest part of the depreciation curve. A used EV often delivers the full fuel and maintenance savings at a price close to the petrol equivalent.
5.Purchase Price
New EVs cost more upfront than comparable petrol cars. The gap varies by segment but averages $5,000 to $10,000 for comparable models in the US market
as of 2026.
Federal Tax Credit
The Inflation Reduction Act provides up to $7,500 in federal tax credit for qualifying new EVs purchased in 2026, subject to income limits and vehicle
price caps. This credit effectively closes much of the purchase price gap for
eligible buyers. Used EVs qualify for up to $4,000 credit under the same act.
Price Gap by Segment
Compact cars: EV premium runs $4,000 to $8,000 over petrol equivalent.Mid-size sedans: EV premium runs $5,000 to $12,000.SUVs: EV premium runs $8,000 to $15,000 in many cases.After federal tax credit, the net premium for many models falls to $0 to $7,500 for eligible buyers.
6. Full Cost Comparison
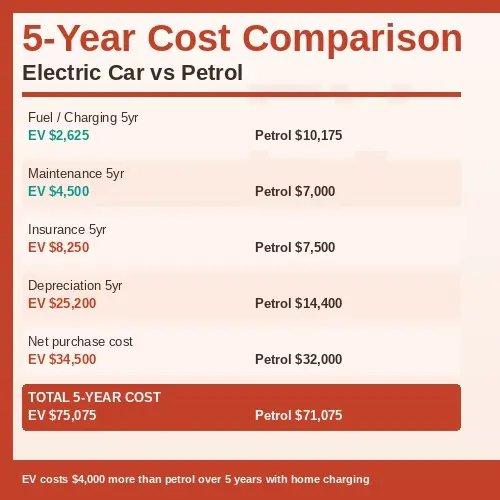
The table below shows a full 5-year cost comparison between a typical EV and a comparable petrol car. Numbers use 15,000 annual miles, home charging at $0.14/kWh, and petrol at $4.07 per gallon.
| Cost Category | EV (5 years) | Petrol (5 years) | Difference |
| Purchase price (net) | $42,000 | $32,000 | EV +$10,000 |
| Federal tax credit | -$7,500 | $0 | EV -$7,500 |
| Net purchase cost | $34,500 | $32,000 | EV +$2,500 |
| Fuel/charging (5yr) | $2,625 | $10,175 | EV -$7,550 |
| Maintenance (5yr) | $4,500 | $7,000 | EV -$2,500 |
| Insurance (5yr) | $8,250 | $7,500 | EV +$750 |
| Depreciation (5yr) | $25,200 | $14,400 | EV +$10,800 |
| TOTAL 5-YEAR COST | $75,075 | $71,075 | EV +$4,000 |
At 15,000 miles per year with home charging, the EV costs roughly $4,000 more over 5 years in this example. The picture improves for higher-mileage drivers and worsens for those relying on public charging.
Use our cost per mile calculator to plug in your own numbers and see the full breakdown for your situation.
7. Breakeven Point
The breakeven point is where total EV cost equals total petrol car cost. At this point, every additional mile driven saves money in the EV.
Breakeven by Annual Mileage
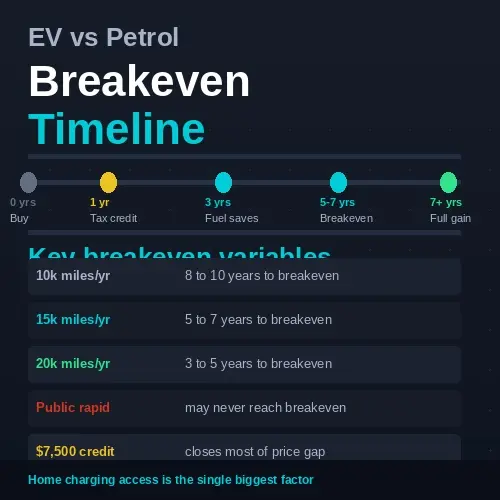
At 10,000 miles per year with home charging, breakeven takes approximately 8 to 10 years. At 15,000 miles per year, breakeven comes at 5 to 7 years.At 20,000 miles per year, breakeven arrives in 3 to 5 years. Drivers relying on public rapid charging may never reach breakeven compared to a petrol car.
Key Breakeven Variables
Fuel savings per year. Higher mileage and higher petrol prices accelerate breakeven. Home charging versus public charging makes the largest difference.
Purchase price gap. After federal tax credit, this is often $0 to $5,000 for eligible buyers, dramatically accelerating breakeven.
Depreciation gap. This is the hardest variable to predict and the most significant. If EV values stabilise as the market matures, the breakeven
will improve.
EV vs Petrol Quick Decision Checklist
Before choosing, run through this checklist. More YES answers in the EV column means an EV is likely the better financial choice for your situation.
| Question | EV Wins | Petrol Wins |
| Do you have home charging access? | YES | NO |
| Do you drive 12,000+ miles per year? | YES | NO |
| Will you keep the car 5+ years? | YES | NO |
| Do you qualify for the $7,500 tax credit? | YES | NO |
| s your daily commute under 200 miles? | YES | NO |
| Do you mainly drive local/urban routes? | YES | NO |
| Do you regularly drive 300+ miles per trip? | NO | YES |
| Is your main concern upfront cost? | NO | YES |
If you answered YES to 5 or more EV questions, home-charging EV ownership
is likely cheaper over 5 years than a comparable petrol car for your situation.
8. Who Should Buy an EV vs Petrol?
The electric car running costs vs petrol comparison gives a clear answer for some drivers and an ambiguous one for others. Your charging situation, annual mileage, and how long you keep the vehicle determine which comes out ahead. Neither is universally better.
Buy an EV If You
Drive 12,000 or more miles per year. Fuel savings compound quickly at high mileage. Have access to home charging. This is the single most important factor. Without it, the fuel cost advantage largely disappears. Plan to keep the vehicle 5 years or longer. The fuel and maintenance savings take time to offset the higher purchase price. Qualify for the $7,500 federal tax credit. This closes most of the purchase price gap for eligible buyers.
Stick With Petrol If You
Rely mainly on public rapid charging with no home charging option.Drive fewer than 8,000 miles per year where fuel savings are small.Plan to sell the vehicle within 3 years where depreciation erases the gains.Need maximum range without planning charging stops on long journeys.
The Middle Ground
If you drive high annual mileage, have access to home charging, or can utilise salary sacrifice schemes, electric cars often come out ahead on full wnership costs including fuel, tax, and maintenance. For drivers with lower mileage or no access to home charging, petrol may still be more economical.
Use our EV vs petrol calculator to enter your own numbers and get a personalised comparison. Use our monthly fuel cost calculator to estimate your current monthly fuel spend, then compare it against what home charging would cost at your local electricity rate.
Methodology
Fuel and charging cost per mile calculations use $4.07 per gallon (Consumer
Reports national average June 2026), US average home electricity of $0.14 per kWh (EIA June 2026), and EPA-rated EV efficiency adjusted 10 percent for
real-world conditions. Maintenance figures are sourced from AAA Your Driving
Costs 2025 and Consumer Reports reliability data. Depreciation data comes from Cap HPI analysis published by Carwow, June 2026. Insurance premium difference sourced from The Electric Car Scheme report June 2026. Federal tax credit information from IRS.gov EV credit guidance 2026. Individual results will vary by vehicle model, local electricity and fuel prices, driving patterns, and
personal tax situation. This article is not financial or tax advice.