Hybrid vs Petrol Running Costs: Which Is Cheaper in 2026?
Key Findings
- Self-charging hybrids save $300 to $700 annually on fuel
- Hybrid fuel economy is usually 25 to 40 percent better than petrol
- Used hybrid demand grew 41.8 percent in Q1 2026 per iSeeCars
- PHEVs only save money when charged consistently
Hybrid vs Petrol Running Costs Summary
- Hybrids save $300 to $700 annually on fuel
- Best advantage in city and stop-start driving
- Petrol cars are cheaper to buy upfront
- Hybrid breakeven usually falls within 3 to 5 years
- PHEVs only save money when charged regularly
Hybrid vs petrol running costs come down to one question every driver actually asks at the dealership: will the extra money I pay upfront ever come back to me at the pump? You have probably seen a hybrid version of the exact car you want, sitting there $2,500 to $3,000 more expensive, and wondered whether that premium is worth it or just marketing. The honest answer nobody gives you straight is that it depends entirely on how many miles you drive and where you drive them.
Most comparison articles bury this in vague pros and cons lists. This guide does the opposite. It puts real dollar figures on fuel savings, maintenance, insurance, depreciation, and the one number that matters most, your breakeven point, so you can see exactly when a self-charging hybrid starts saving you money and when a petrol car quietly stays the cheaper choice.
There is also a trap most buyers fall into: assuming every hybrid saves money. Plug-in hybrids do not, unless you charge them daily. We separate self-charging hybrids from plug-in hybrids clearly, because treating them as one thing is how people end up paying more, not less.
Quick Answer: Self-charging hybrids save $300 to $700 per year in fuel versus petrol, mainly from stop-start city driving, with most drivers breaking even on the higher purchase price within 3 to 5 years. Plug-in hybrids only save money if charged consistently and driven mostly in electric mode, otherwise they can cost more to run than a standard petrol car.
Hybrid vs Petrol: Quick Comparison
| Factor | Hybrid | Petrol |
| Fuel economy | Better | Lower |
| Fuel cost | Lower | Higher |
| Maintenance | Similar | Similar |
| Insurance | Slightly higher | Lower |
| Resale value | Better | Average |
| Purchase price | Higher | Lower |
Self-Charging Hybrid vs Plug-In Hybrid
Hybrid is not a single category. Self-charging hybrids and plug-in hybrids have fundamentally different cost profiles, and confusing the two leads to misleading running cost comparisons.
Self-Charging Hybrids
Self-charging hybrids combine a petrol engine with a small battery and electric motor. The battery charges through regenerative braking and engine power, never plugging in. The electric motor assists at low speeds and during acceleration, reducing petrol consumption particularly in stop-start city traffic. Examples include the Toyota Prius, Toyota Corolla Hybrid, and Honda CR-V Hybrid.
Plug-In Hybrids
Plug-in hybrids (PHEVs) have a larger battery that can be charged from an external power source, giving 20 to 45 miles of electric-only range before the petrol engine engages. PHEVs are heavier than self-charging hybrids due to the larger battery, which becomes a fuel economy penalty once the battery is depleted and the car runs on petrol while carrying the extra weight.
Hybrid vs Petrol Running Costs at a Glance
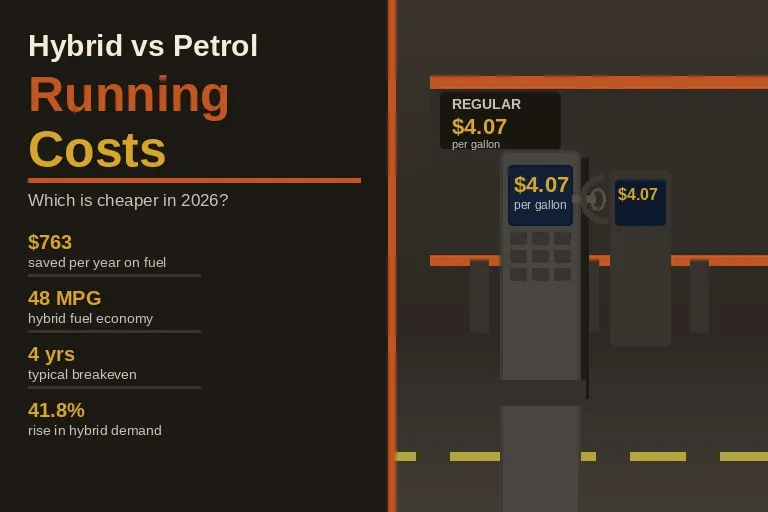
For a driver covering 15,000 miles annually at $4.07 per gallon, the numbers come down to one simple comparison.
Running Costs at a Glance (15,000 mi/yr)
| Item | Petrol | Self-Charging Hybrid |
| Annual fuel cost | $2,035 | $1,272 |
| Annual saving | baseline | $763 |
| 5-year fuel saving | baseline | $3,815 |
This is the core number behind every other section in this guide. Insurance, maintenance, and depreciation slightly offset the total cost, but fuel savings remain the largest and most consistent advantage for self-charging hybrids.
Cost Per Mile: Hybrid vs Petrol
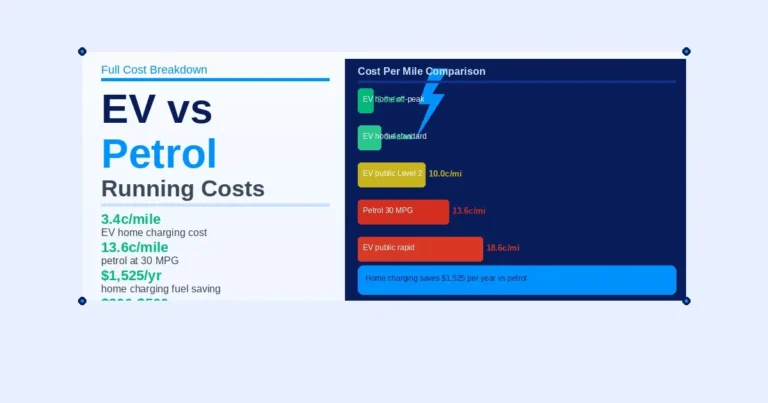
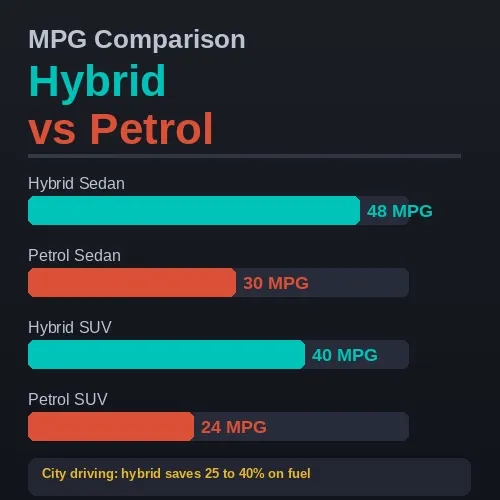
Cost per mile gives the clearest single number for comparing hybrid and petrol running costs. A petrol car at 30 MPG and $4.07 per gallon costs 13.6 cents per mile in fuel. A self-charging hybrid at 48 MPG costs 8.5 cents per mile, a saving of 5.1 cents per mile, or roughly $765 per year at 15,000 annual miles.
| Vehicle Type | MPG | Fuel Cost Per Mile |
| Petrol sedan | 30 | 13.6 cents |
| Self-charging hybrid sedan | 48 | 8.5 cents |
| Petrol SUV | 24 | 17.0 cents |
| Hybrid SUV | 40 | 10.2 cents |
For your full cost per mile, including insurance, maintenance, and depreciation alongside fuel, use our cost per mile calculator.
Real Vehicle Example
Several popular models are available as both conventional petrol and self-charging hybrid, making them useful for like-for-like comparisons.
Real Vehicle Comparison: Petrol vs Hybrid MPG
| Model | Petrol MPG | Hybrid MPG | Annual Fuel Saving |
| Toyota Corolla | 35 | 50 | $574 |
| Honda CR-V | 30 | 40 | $678 |
| Toyota Camry | 32 | 51 | $747 |
Based on $4.07/gal, 15,000 annual miles.
The Toyota Corolla offers the clearest case study. The purchase premium for the hybrid trim is approximately $2,500. At $574 annual fuel savings, the breakeven on fuel alone is 4.4 years. Actual figures vary by trim, region, and driving pattern, but this reflects a common real-world comparison used across the industry.
Fuel Cost Comparison
Fuel is where hybrids show their clearest advantage over petrol, though the size of that advantage depends on driving conditions.
Self-Charging Hybrid Fuel Savings
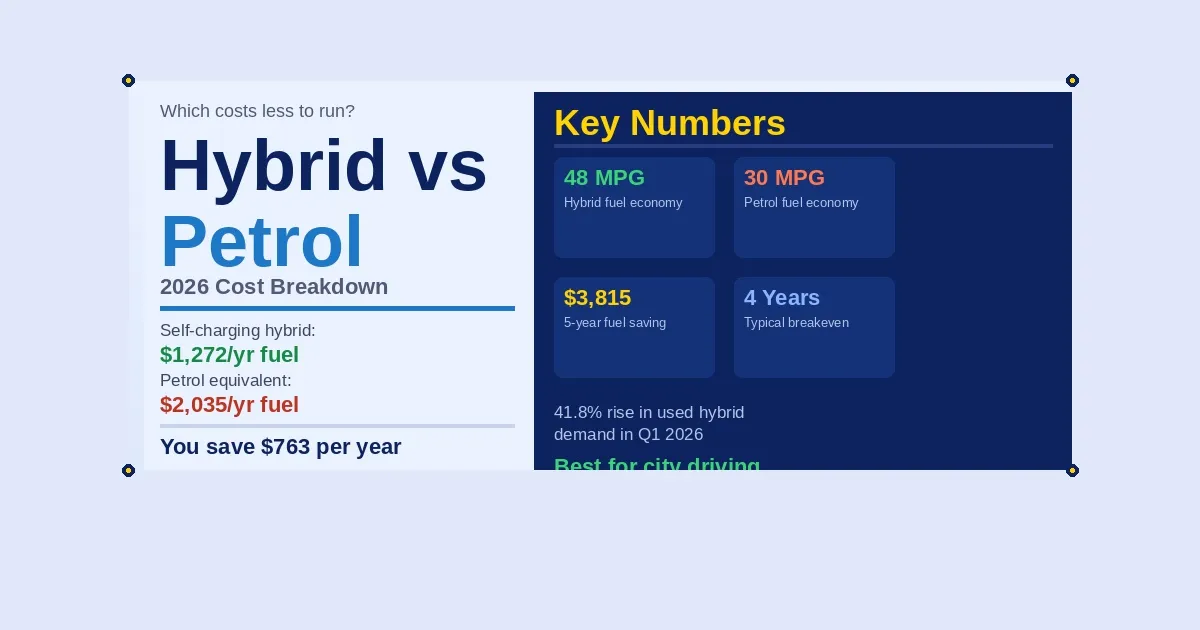
According to EPA combined ratings, self-charging hybrids achieve 25 to 40 percent better fuel economy than comparable petrol cars, with the largest gains in city and stop-start driving. Use our MPG calculator to check your current fuel economy. At $4.07 per gallon and 15,000 annual miles, a hybrid at 48 MPG costs $1,272 per year in fuel versus $2,035 for the petrol equivalent, a saving of $763.
The gap narrows on the motorway, where the petrol engine does most of the work in both vehicles. A hybrid driver doing mainly motorway miles sees 10 to 20 percent fuel savings rather than 25 to 40 percent.
Annual Fuel Saving by Driving Type
| Driving Type | Petrol MPG | Hybrid MPG | Annual Fuel Saving |
| City heavy | 25 | 42 | $1,160 |
| Mixed driving | 30 | 45 | $763 |
| Motorway heavy | 35 | 42 | $254 |
The Plug-In Hybrid Reality Gap
This is the most important factor most comparisons miss. Manufacturer-claimed PHEV fuel economy assumes drivers charge regularly. Real-world data shows this assumption frequently fails.
According to ECIU research published in 2026, the UK’s most popular PHEVs cost owners over £450 extra every year compared with official manufacturer figures, with real-world costs closer to £985 versus claimed figures of around £530. When purchase price, insurance, tax, and servicing were included, the same models cost £81 more per year than a standard petrol car. While this data is UK-based, US drivers face the identical mechanism: a PHEV driven without regular charging runs mostly on petrol while carrying 150 to 300 pounds of extra battery weight, which can produce worse real-world fuel economy than a comparable self-charging hybrid.
Why PHEVs Underperform in Real Use
Drivers without home charging access rarely plug in consistently. Official test cycles assume far more electric-only driving than typical usage, meaning PHEVs only deliver claimed savings when charged at home or work daily.
Maintenance Costs
Hybrid maintenance costs are close to petrol in routine servicing, but differ on two key points: brake wear and system complexity. Self-charging hybrids win on brakes. PHEVs carry a complexity penalty that can increase repair costs when something goes wrong.
Self-Charging Hybrid Maintenance
Routine maintenance for self-charging hybrids is comparable to that of petrol cars, with one clear advantage. Regenerative braking reduces wear on friction brakes meaningfully, often doubling brake pad life. This saves $100 to $200 over a typical brake replacement interval. Oil changes, air filters, and tyre rotation follow the same schedule as petrol cars. Hybrid batteries carry 8- to 10-year manufacturer warranties and rarely need replacement within common ownership periods. Toyota and Honda hybrid battery replacement costs run $1,500 to $3,000 if replacement is ever needed outside warranty, though real-world data shows most hybrid batteries exceed 150,000 miles without failure.
Plug-In Hybrid Maintenance
PHEVs combine a petrol engine, electric motor, larger battery pack, and charging hardware into one system. More components mean more things that can develop faults, and PHEV-specific repairs cost more than equivalent petrol repairs due to the specialist knowledge and parts required. Brake pad life is still better than a petrol car due to regenerative braking, but the saving is smaller than that of a self-charging hybrid since the heavier PHEV weight increases overall brake wear. Routine servicing intervals are similar to self-charging hybrids, but budget for higher repair costs when faults do occur, particularly on the charging system and high-voltage battery components.
Depreciation and Resale Value
According to iSeeCars data, used hybrid demand grew 41.8 percent year over year in Q1 2026, far outpacing 15.9 percent growth for EVs. This demand has kept hybrid residual values stronger than comparable petrol cars in most segments, as buyers seek a transitional option between conventional petrol and full electric.
Toyota hybrid models in particular have shown strong resale performance. The Toyota Prius and Corolla Hybrid consistently retain 55 to 65 percent of their original value after 3 years, compared to 45 to 55 percent for comparable non-hybrid sedans. This gap reflects sustained consumer demand for proven hybrid technology with established reliability records rather than newer EV or PHEV options that carry more uncertainty around battery longevity and technology changes.
Self-charging hybrids hold value better than petrol equivalents across most segments. PHEV depreciation is less consistent and can be steeper for models that gained a reputation for underperforming on real-world fuel economy following coverage of research like the ECIU study.
Insurance Costs
Hybrid insurance runs 3 to 7 percent higher than petrol due to repair complexity from additional electric components. A damaged hybrid battery pack can cost $2,000 to $6,000 to replace outside warranty, well above a petrol engine repair, and insurers price this risk into premiums even though actual failure is rare within typical ownership periods. This gap has narrowed as hybrid technology has become mainstream. PHEVs usually see a slightly larger premium than self-charging hybrids due to the larger battery and charging hardware.
Breakeven Timeline
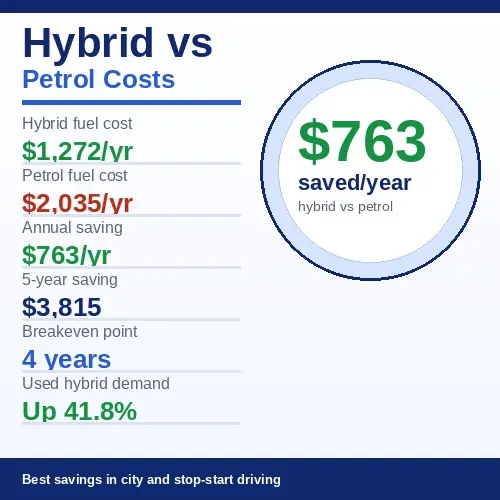
The hybrid vs petrol running costs breakeven shows when fuel savings recover the purchase premium.
Self-Charging Hybrid Example
Purchase premium: $3,000. Annual fuel saving: $750. Breakeven: 4 years.
This is the common pattern for a self-charging hybrid purchased to replace a comparable petrol model. For drivers covering 12,000 or more annual miles in mainly city or stop-start conditions, this breakeven timeline holds consistently, often falling between 3 and 5 years depending on the exact purchase premium and driving pattern.
Plug-In Hybrid Timeline
PHEV breakeven depends entirely on charging discipline. A driver who charges daily and completes most trips within electric range may see savings similar to or better than a self-charging hybrid. A driver who rarely charges may never break even, since the purchase premium runs higher than for self-charging hybrids while real-world fuel savings can be minimal once added weight is factored in.
Use our fuel cost calculator to compare fuel costs at your specific MPG figures. For longer journeys, our trip fuel calculator estimates total fuel cost by distance and vehicle type.
When to Choose Hybrid vs Petrol
The data in this guide points to a clear decision framework. Your annual mileage, driving pattern, and charging access determine which powertrain saves you money. No single answer fits every driver.
Choose a Self-Charging Hybrid If You
Do mainly city or stop-start driving, since this is where electric assist delivers the biggest fuel savings at 25 to 40 percent better economy. Cover 12,000 or more miles per year so fuel savings accumulate fast enough to recover the purchase premium within a reasonable ownership period. Want lower brake maintenance costs from regenerative braking without adding any charging routine to your day.
Choose a Plug-In Hybrid Only If You
Have reliable daily access to home or work charging and can commit to using it consistently. Complete most regular trips within the electric-only range, usually 20 to 45 miles per charge. A PHEV that gets charged daily on short urban commutes delivers genuine savings. The same PHEV driven mainly on the motorway without regular charging costs more to run than a comparable petrol car.
Choose Petrol If You
Do mainly motorway driving where hybrid fuel savings shrink to 10 to 20 percent, making the purchase premium hard to recover. Drive under 10,000 miles per year, since fuel savings at low mileage rarely offset the higher upfront cost within a typical 5- to 7-year ownership period. Want the lowest purchase price and simplest maintenance profile with no hybrid complexity.
Who Should Not Buy a Hybrid?
Drivers covering under 8,000 miles annually rarely recover the purchase premium within a common ownership period. Motorway-heavy drivers see the smallest fuel economy advantage since the hybrid’s electric assist provides less benefit at steady highway speeds. Buyers planning to sell within 1 to 2 years will not hold the vehicle long enough for fuel savings to offset the higher upfront cost. If your driving is low-mileage and mostly highway, petrol is the more cost-effective choice.
Use our monthly fuel cost calculator to track your actual monthly fuel spend against hybrid savings estimates.
Frequently Asked Questions
Methodology
Fuel and cost figures use $4.07 per gallon (Consumer Reports, June 2026) and 15,000 annual miles. PHEV data from ECIU and Transport and Environment, January 2026. Hybrid demand data from iSeeCars Q1 2026.
Written by James Wilson, Automotive Efficiency Researcher, FuelConsumptionCalc.com.
Reviewed using EPA fuel economy data, ECIU real-world cost research, and Consumer Reports fuel pricing.Sources: Energy and Climate Intelligence Unit (ECIU) January 2026, Transport and Environment 2026, iSeeCars Q1 2026, Consumer Reports June 2026, EPA Fuel Economy Data 2026.
Last Updated: September 2026