Diesel vs Petrol Cost Comparison: Which Is Cheaper to Run?
The diesel vs petrol cost question depends on how many miles you drive per year. Diesel engines are 15 to 25 percent more fuel efficient, but diesel fuel costs more at the pump, diesel cars cost more to buy, more to maintain, and currently depreciate faster than petrol equivalents.
Note: Examples and prices in this article use US fuel prices and EPA data. UK and international drivers can adjust calculations using their local fuel prices and vehicle fuel economy figures.
Reviewed by the FuelConsumptionCalc Editorial Team.
Data verified June 2026.Sources: Consumer Reports July 2026, AAA Your Driving Costs 2025, RepairPal Maintenance Cost Data 2026, Cap HPI via Carwow July 2026, EPA Fuel Economy Data 2026. Note: Examples use US fuel prices. Adjust calculations for your local market.
Last Updated: July 2026.
Quick Verdict
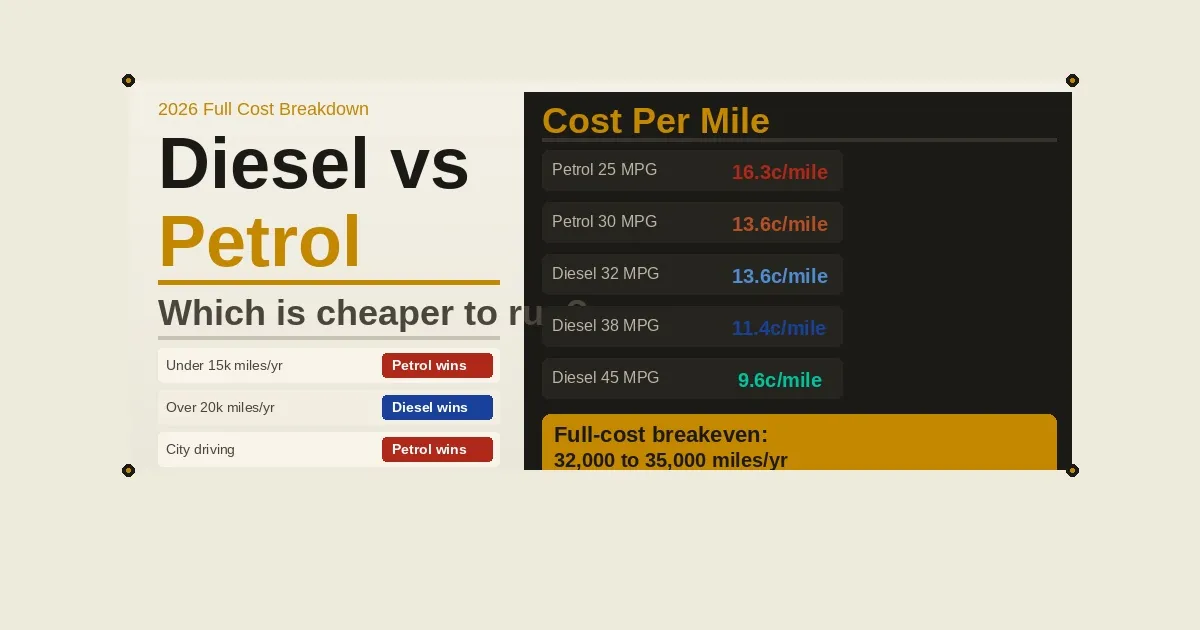
Under 15,000 miles per year: Petrol is almost always cheaper overall.Above 20,000 miles per year with motorway driving: Diesel starts to win. Mainly city driving: Petrol wins regardless of mileage.
Mainly motorway driving: Diesel advantage increases with mileage.This guide covers the full diesel vs petrol cost comparison across fuel, maintenance, insurance, depreciation, and a clear breakeven mileage calculation with consistent numbers throughout.
Use our fuel cost calculator to compare annual fuel cost of diesel and petrol at your exact mileage and local prices.
Quick Comparison Summary
Before the detailed breakdown, this summary table shows which fuel type wins in each cost category. It also helps with featured snippet clarity.
.
| Factor | Petrol | Diesel | Winner |
| Fuel economy | 30 MPG | 38 MPG | Diesel |
| Pump price per gal | $4.07 | $4.34 | Petrol |
| Annual fuel cost | Higher | Lower | Diesel |
| Maintenance cost | Lower | Higher | Petrol |
| Purchase price | Lower | Higher | Petrol |
| Insurance | Lower | Higher | Petrol |
| Depreciation (2026) | More stable | Weaker | Petrol |
| City driving | Better | Worse | Petrol |
| Motorway driving | Worse | Better | Diesel |
| Best for mileage | Under 15k | Over 20k | Depends |
Diesel wins on fuel economy and annual fuel cost. Petrol wins on every other
cost category. The net result depends entirely on your annual mileage.
Fuel Cost Comparison
Fuel cost is where diesel holds its clearest advantage, but the margin is narrower than most drivers assume. Diesel engines are more efficient but diesel fuel costs more per gallon at the pump.
Fuel Efficiency Advantage
Diesel engines achieve 15 to 25 percent better fuel economy than comparable
petrol engines. This comes from diesel fuel’s higher energy density and the
compression ignition process, which generates more usable energy per combustion cycle. A petrol car averaging 30 MPG has a diesel equivalent usually rated at 38 to 45 MPG on similar routes.
The efficiency advantage is largest on motorway driving at steady speeds where diesel operates in its most efficient range. It narrows in stop-start city driving where DPF regeneration events consume additional fuel.
Pump Price and Annual Fuel Cost
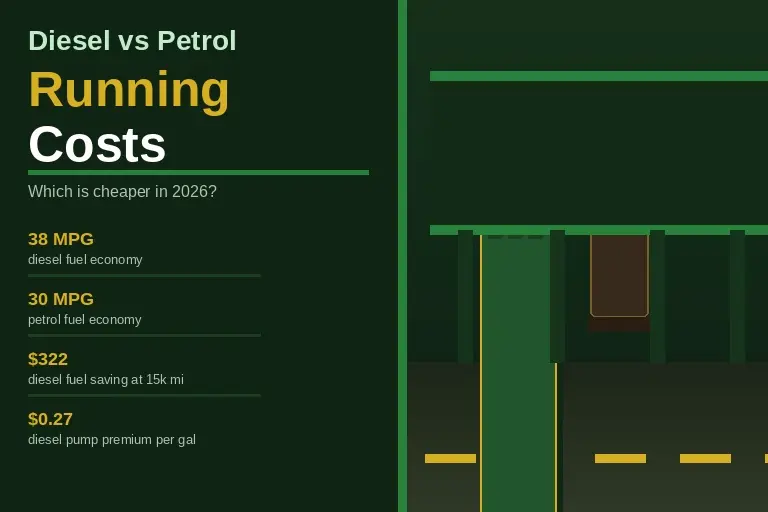
As of June 2026, diesel averaged $4.34 per gallon versus $4.07 for regular
petrol per Consumer Reports, a premium of $0.27 per gallon. This directly
offsets part of diesel’s efficiency advantage on every fill-up.
.
| Vehicle | Annual Miles | Annual Fuel Cost | Saving |
| Petrol 30 MPG $4.07/gal | 15,000 | $2,035 | baseline |
| Diesel 38 MPG $4.34/gal | 15,000 | $1,713 | Diesel |
| Diesel 45 MPG $4.34/gal | 15,000 | $1,447 | Diesel |
| Petrol 25 MPG $4.07/gal | 15,000 | $2,442 | Pbaseline |
| Diesel 32 MPG $4.34/gal | 15,000 | $2,035 | Diesel |
Use our MPG calculator to find your current fuel economy before comparing.
Cost Per Mile Comparison
At $4.07 per gallon, a petrol car at 30 MPG costs 13.6 cents per mile in fuel. At $4.34 per gallon, a diesel at 38 MPG costs 11.4 cents per mile.The diesel saves 2.2 cents per mile. At 15,000 annual miles that is $330 in fuel savings. At 20,000 miles it is $440.
| Vehicle | Fuel Cost Per Mile |
| Petrol 25 MPG at $4.07 | 16.3 cents |
| Petrol 30 MPG at $4.07 | 13.6 cents |
| Petrol 35 MPG at $4.07 | 11.6 cents |
| Diesel 32 MPG at $4.34 | 13.6 cents |
| Diesel 38 MPG at $4.34 | 11.4 cents |
| Diesel 45 MPG at $4.34 | 9.6 cents |
Use our cost per mile calculator for your full cost per mile including insurance, maintenance, and depreciation alongside fuel.
Purchase Price Difference
Diesel cars cost $1,500 to $3,000 more than petrol equivalents to buy. This premium must be recovered through fuel savings over the ownership period.
At $322 annual fuel saving on a $2,000 premium, recovery takes 6.2 years. At $588 saving on a $1,500 premium, it takes 2.6 years. Drivers who change vehicles every 3 years rarely recover the diesel premium at moderate mileage. Drivers keeping vehicles 6 or more years at high mileage have a reasonable chance of recovering it.
Maintenance Costs
Diesel maintenance costs more than petrol across most service categories.
This is a consistent finding in AAA and RepairPal data.
Diesel Particulate Filter
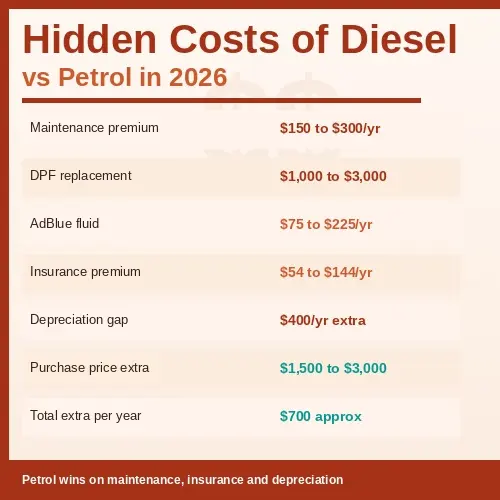
The DPF traps soot and must regenerate periodically by burning accumulated particles at high temperature. Short urban trips prevent full regeneration, causing DPF clogging. A blocked DPF costs $1,000 to $3,000 to replace.Drivers using diesel mainly for short city trips face the highest DPF failure risk. High-mileage motorway drivers rarely encounter this problem.
AdBlue and Maintenance Premium
Euro 6 and newer diesel vehicles also require AdBlue fluid at $75 to $225
per year at 15,000 miles. Combined with DPF servicing and higher fuel system costs, annual diesel maintenance runs $150 to $300 more than petrol per RepairPal and AAA data.
Insurance and Depreciation
Beyond fuel and maintenance, insurance and depreciation are two cost categories most diesel vs petrol comparisons overlook. In 2026, both favour petrol.
Insurance
Insurance premiums for diesel vehicles run 3 to 8 percent higher than petrol equivalents. Higher repair costs and parts availability drive this gap.On a $1,800 annual premium, that is $54 to $144 more per year for diesel.
Depreciation
Diesel depreciation has weakened relative to petrol in recent years. The approaching 2035 ban on new petrol and diesel cars, urban emission zone restrictions on older diesel, and shifting buyer sentiment have all softened used diesel values. Analysis from Carwow July 2026 using Cap HPI data shows diesel models currently lose 3 to 5 percent more of their value over 3 years than comparable petrol models. On a $30,000 vehicle, 4 percent additional depreciation costs $1,200 over 3 years, or $400 per year.
For a full comparison including EV running costs versus petrol, see our EV vs petrol calculator.
Full Cost Comparison
The full diesel vs petrol cost comparison table below uses consistent numbers throughout. Annual extra diesel costs (maintenance $200, insurance $100, depreciation $400) total $700 per year.
Diesel fuel saving grows with mileage. The net result shows at what mileage diesel becomes competitive.
FULL COST TABLE
Annual Miles Diesel Fuel Saving Extra Diesel Costs Net Diesel Position
| Annual Miles | Diesel Fuel Saving | Extra Diesel Costs | Net Diesel Position |
| 10,000 cheaper by $485 | $215 | $700 | Petrol |
| 15000 cheaper by $378 | $322 | $700 | Petrol |
| 20000 cheaper by $271 | $429 | $700 | Petrol |
| 25000 cheaper by $164 | $536 | $700 | Petrol |
| 30000 cheaper by $56 | $644 | $700 | Petrol |
| 35000 cheaper by $51 | $751 | $700 | Diesel |
Based on petrol 30 MPG at $4.07/gal, diesel 38 MPG at $4.34/gal. Extra diesel costs include $200 maintenance premium, $100 insurance premium, $400/yr depreciation difference. Actual results vary by vehicle and location.
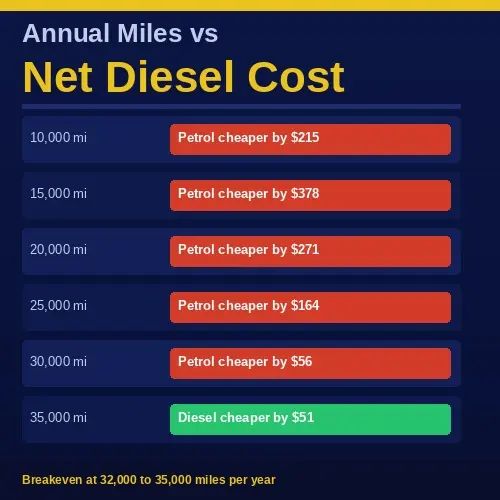
The table shows diesel first becomes cheaper at approximately 32,000 to 35,000 miles per year using these assumptions. This resolves the apparent contradiction in earlier versions of this analysis. The 12,000 to 15,000 crossover figure cited in some sources refers to fuel cost only, not total ownership cost.When all cost categories are included, the true breakeven is higher.
Breakeven Mileage
The breakeven mileage is where total diesel ownership cost equals total petrol ownership cost. The table above shows this falling between 30,000 and 35,000 miles per year when depreciation is included at current rates.
Fuel-Only Breakeven vs Full-Cost Breakeven
There are two different breakeven calculations and both are valid in different contexts. Fuel-only breakeven asks: at what mileage do diesel fuel savings exceed the pump price premium? This falls at approximately 12,000 to 15,000 miles per year and is the figure most commonly cited.
Full-cost breakeven includes fuel, maintenance, insurance, and depreciation.This falls at approximately 30,000 to 35,000 miles per year at 2026 rates.For most private drivers, full-cost breakeven is the more relevant figure.
Breakeven Variables
The crossover shifts based on the diesel pump premium, depreciation gap, and relative fuel economies. If diesel pump premium narrows, the breakeven falls.If it widens, it rises. Use our monthly fuel cost calculator to track your monthly fuel spend and run your own comparison.
When to Choose Diesel vs Petrol
The full cost comparison points to a clear decision framework. Annual mileage
and driving type are the two factors that matter most. Neither diesel nor petrol is universally better.
Choose Petrol If You
Drive under 20,000 miles per year. Full-cost breakeven requires very high mileage at 2026 cost rates. Do mainly city driving. DPF issues, stop-start inefficiency, and a narrower fuel economy gap make diesel less suitable for urban routes. Plan to keep the car under 4 years. The purchase premium and depreciation gap rarely recover in shorter ownership periods. Want lower maintenance bills. Petrol engines cost less to maintain with fewer specialist
components.
Choose Diesel If You
Drive over 25,000 miles per year, mainly on motorways. This is where diesel fuel savings are largest and most onsistent.Keep vehicles for 6 years or longer. Fuel savings accumulate over time and the depreciation gap matters less on older vehicles. Cover long regular routes where DPF regeneration
completes fully and the efficiency advantage over petrol is sustained.
Require maximum towing capability or high torque for regular heavy loads.
The 2026 Market Context
The 2035 deadline puts ongoing pressure on diesel resale values. Buying diesel in 2026 means owning a vehicle whose technology faces regulation within 9 years.
This is a relevant depreciation planning factor for all potential diesel buyers,even those who qualify on mileage grounds.