Best Speed for Fuel Economy: What the Data Actually Shows
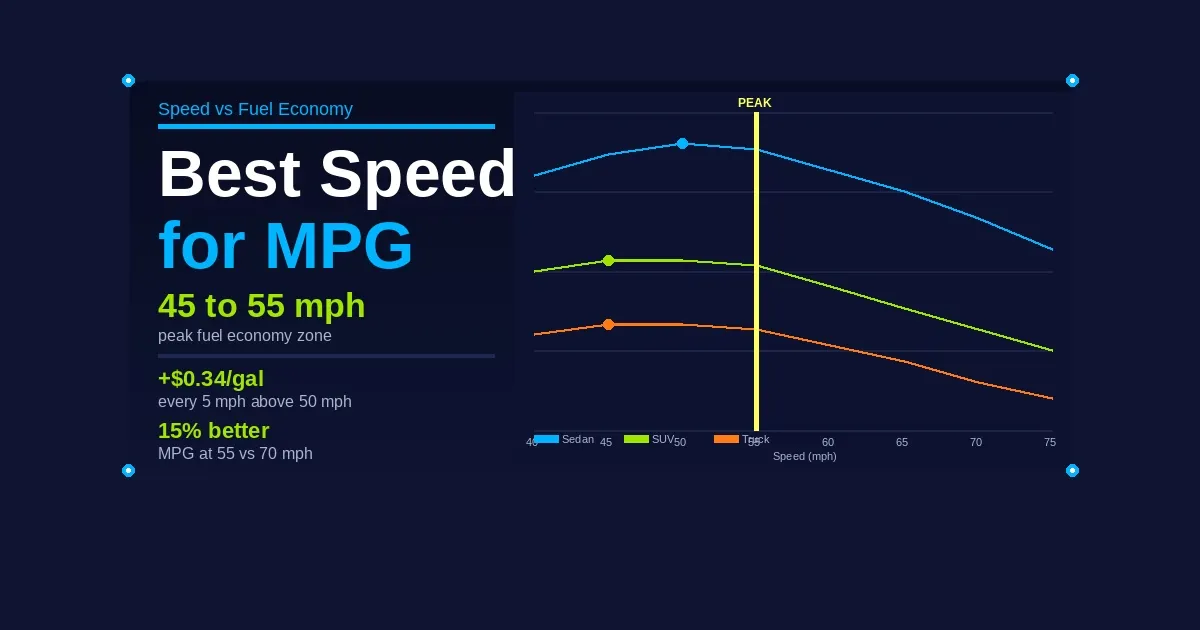
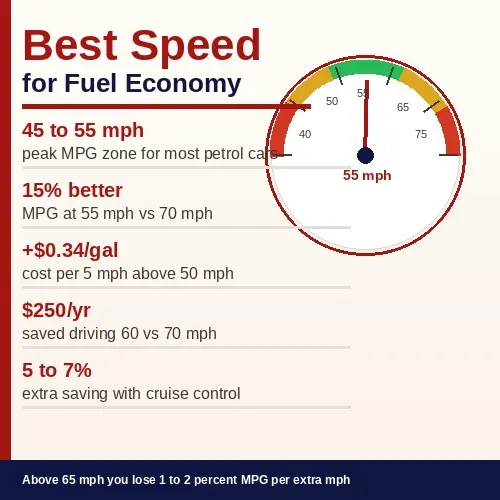
For most conventional petrol cars, fuel economy tends to peak around 45 to 55 mph. Above this range, aerodynamic drag increases sharply and fuel consumption rises with every additional mph. Below about 20 mph, engine inefficiency at low RPM reduces economy.
According to DOE fueleconomy.gov, every 5 mph you drive above 50 mph is roughly equivalent to paying an additional $0.34 per gallon. EPA data shows a 2.0-litre sedan achieves approximately 15 percent better fuel economy at 55 mph than at 70 mph.
Use our MPG calculator to track the best speed for fuel economy on your specific vehicle by comparing MPG at different cruise speeds.
Reviewed by the FuelConsumptionCalc Editorial Team.
Sources: Argonne National Laboratory Autonomie Model via U.S. Alternative
Fuels Data Center (July 2026), DOE fueleconomy.gov, EPA 2026 Fuel Economy
Data, Consumer Reports July 2026.
Last Updated: July 2026.
Quick Answer
For most conventional petrol cars, the best speed for fuel economy is 45 to 55 mph based on Argonne National Laboratory modelling.Every 5 mph above 50 mph costs roughly $0.34 per gallon extra per DOE data. Driving at 60 mph instead of 70 mph saves 5 to 10 percent in fuel economy and adds about 26 minutes on a 300-mile journey.
Why Speed Affects Fuel Economy
Understanding why speed affects fuel economy explains the curve shape and helps you make smarter choices at different speeds on different road types. Three forces work together to determine fuel use at any given speed.
Aerodynamic Drag
Aerodynamic drag is the dominant factor above 50 mph. The power required to overcome drag increases with the cube of speed. This means doubling your speed requires roughly eight times the aerodynamic power. According to DOE fueleconomy.gov, at 70 mph aerodynamic drag accounts for over 50 percent of total engine load. At 55 mph this drops to around 35 percent.
Headwinds and tailwinds amplify this effect meaningfully. A 20 mph headwind while driving at 55 mph creates aerodynamic drag closer to what you would experience driving at 75 mph in calm conditions. Tailwinds reduce drag and improve economy. This is why the same vehicle on the same route can show noticeably different fuel economy on different days.
Rolling Resistance and Tyre Pressure
Rolling resistance from tyres against the road increases linearly with speed,not exponentially. At lower speeds it is the dominant resistance force. At
motorway speeds, aerodynamic drag overtakes it.
Tyre pressure has a direct impact. According to DOE data, each 1 PSI of underinflation reduces fuel economy by about 0.2 percent. Tyres underinflated
by 5 PSI reduce economy by approximately 1 percent at any speed. Correct tyre pressure matters most in urban driving where rolling resistance dominates, but remains relevant at all speeds.
Engine Efficiency and Transmission
Circle K’s Inner Circle program gives 25 cents per gallon off on your first five fuel-ups, then 3 cents off per gallon after that. Spending $500 within a year upgrades you to Premium membership, which increases the discount to 5 cents off per gallon. Free to join. No annual fee.
At 55 mph in top gear on a flat road, most modern engines run at 1,500 to 2,000 RPM where fuel efficiency peaks. At 70 mph, RPM rises and throttle opening increases, pushing the engine away from its most efficient operating point.
Transmission type affects the optimal speed range. CVT transmissions keep the engine in its most efficient RPM band across a wider speed range than traditional step-gear automatics. Manual transmission drivers can optimise by shifting into top gear as early as road conditions allow.
The Optimal Speed Range
Argonne National Laboratory modelling using the Autonomie simulation tool found that midsize conventional petrol cars tend to achieve their best fuel economy at around 55 mph. The Argonne data is published by the U.S. Alternative Fuels Data Center and represents modelled estimates for midsize vehicle classes.
For midsize diesel cars, the curve declines gradually from 45 to 55 mph and then drops sharply above that. For midsize hybrid electric vehicles, Argonne modelling shows efficiency falls more evenly between 45 and 75 mph as the electric motor assists at speeds where the petrol engine is least efficient.
EPA data confirms that a 2.0-litre sedan achieves approximately 15 percent better fuel economy at 55 mph than at 70 mph. Above 65 mph, most conventional petrol cars lose approximately 1 to 2 percent of fuel economy for each additional mph driven.
Speed vs MPG: Data Table
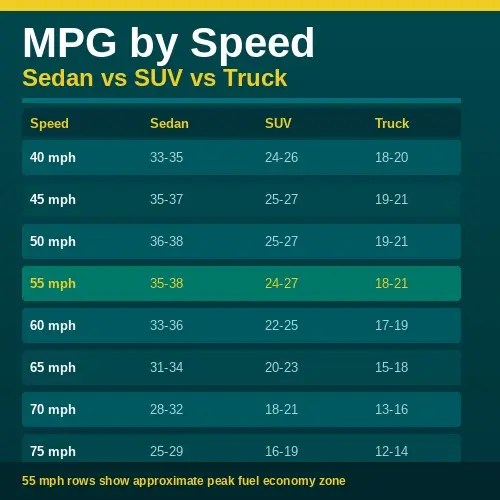
The table below shows illustrative fuel economy estimates at different speeds for three common vehicle types. Values are based on Argonne Autonomie modelling data and EPA speed-economy trends. Actual figures vary by vehicle
make, aerodynamic profile, tyre type, and road conditions.
| Speed | Small Sedan (35 MPG rated) | SUV (26 MPG rated) | Truck (20 MPG rated) |
| 40 mph | 33 to 35 MPG | 24 to 26 MPG | 18 to 20 MPG |
| 45 mph | 35 to 37 MPG | 25 to 27 MPG | 19 to 21 MPG |
| 50 mph | 36 to 38 MPG | 25 to 27 MPG | 19 to 21 MPG |
| 55 mph | 35 to 38 MPG | 24 to 27 MPG | 18 to 21 MPG |
| 60 mph | 33 to 36 MPG | 22 to 25 MPG | 17 to 19 MPG |
| 65 mph | 31 to 34 MPG | 20 to 23 MPG | 15 to 18 MPG |
| 70 mph | 28 to 32 MPG | 18 to 21 MPG | 13 to 16 MPG |
| 75 mph | 25 to 29 MPG | 16 to 19 MPG | 12 to 14 MPG |
Illustrative estimates based on Argonne Autonomie modelling and EPA trends.
Actual MPG varies by vehicle. 55 mph rows highlighted as approximate peak zone.
Use our fuel cost calculator to calculate the exact fuel cost at your vehicle’s actual MPG and local fuel price.
Fuel vs Time Trade-Off
Slowing down from 70 mph to 55 mph saves fuel but adds journey time. Most drivers want to know both numbers before making the decision.
| Speed Added vs 70 mph | Time: 300 miles | Fuel Cost (30 MPG, $4.07/gal) | Time |
| 55 mph | 5 hrs 27 min | $10.18 | 52 |
| 60 mph | 5 hrs 0 min | $11.29 | 26 |
| 65 mph | 4 hrs 37 min | $12.11 | 3 |
| 70 mph | 4 hrs 17 min | $13.57 | 18 to 21 MPG |
| 75 mph | 4 hrs 0 min | $15.81 | 17 |
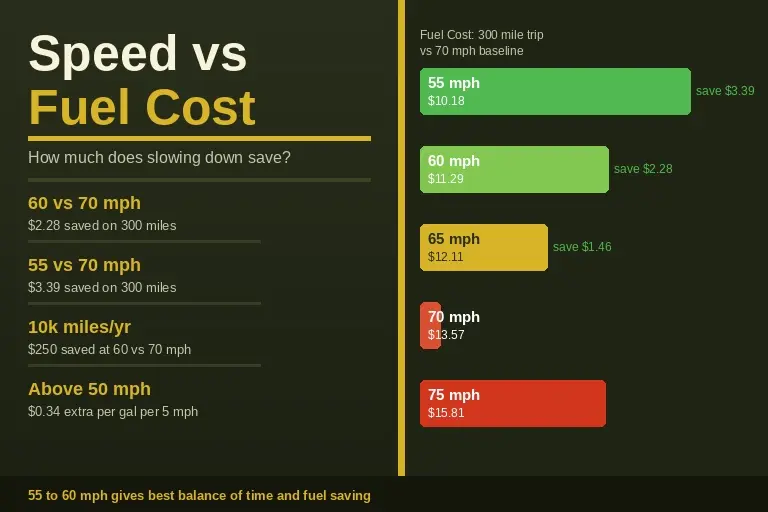
At 55 mph versus 70 mph on a 300-mile journey: fuel saving is $3.39, time cost is 52 minutes. At 60 mph versus 70 mph: fuel saving is $2.28, time cost is 26 minutes. The 60 mph vs 70 mph trade-off gives a reasonable balance of saving and time for most drivers.
Over 10,000 annual motorway miles, consistently driving at 60 mph instead of 70 mph saves roughly $250 per year in fuel at $4.07 per gallon and 30 MPG.
Use our trip fuel calculator to compare the fuel cost of any specific journey at different speed assumptions.
According to DOE fueleconomy.gov, every 5 mph above 50 mph is equivalent to paying an extra $0.34 per gallon. At $4.07 per gallon, driving at 75 mph effectively costs $4.75 per gallon for the miles covered.
Factors That Shift the Optimal Speed
The 45 to 55 mph range applies to conventional midsize petrol cars on flat roads in calm conditions. Several factors shift this range for specific vehicles and conditions.
Vehicle Type and Aerodynamics
Compact sedans with low frontal areas maintain reasonable fuel economy to 60 mph. Full-size SUVs and pickup trucks with large frontal areas see sharper drops above 55 mph. A full-size SUV at 70 mph uses 15 to 20 percent more fuel per mile than at 55 mph. A compact sedan loses 10 to 14 percent over the same speed range.
Headwinds and Weather
Wind conditions shift the effective drag speed. A 20 mph headwind at 55 mph creates aerodynamic drag equivalent to calm-air driving at around 75 mph.On exposed motorway routes on windy days, fuel economy at 55 mph can be similar to a calm-day run at 70 mph. Tailwinds improve economy for the same reason. Checking wind conditions before long motorway journeys helps set realistic fuel expectations.
Road Gradient
Uphill sections increase fuel consumption at any speed as the engine works against gravity. Downhill sections reduce it. On hilly routes, maintaining a moderate speed and using engine braking on descents often saves more fuel than targeting a specific cruise speed.
Practical Application
The data on best speed for fuel economy leads to clear choices for motorway and urban driving. These apply regardless of vehicle type, though the exact savings vary based on your specific aerodynamic profile.
Motorway Driving
For most petrol cars, 55 to 60 mph on flat motorways offers the best balance of fuel economy and practical journey time. At 60 mph, fuel economy is 5 to
8 percent lower than the theoretical peak at 55 mph but the time saving over a long journey is meaningful.
Cruise control on flat sections saves an additional 5 to 7 percent by eliminating minor speed variations, per DOE fueleconomy.gov guidance. On hilly roads, manual throttle control saves more fuel than cruise control because it avoids the hard acceleration cruise control uses to maintain speed on uphill gradients.
Urban Driving
In stop-start city traffic, targeting a specific cruising speed matters less than smooth acceleration and braking. The biggest city driving gains come from
anticipating stops, coasting to red lights, and avoiding hard acceleration.
Correct tyre pressure adds 0.5 to 3 percent in any driving condition and costs nothing to maintain.
Track how speed changes affect your monthly fuel spend with our monthly fuel cost calculator. Record your monthly spend before and after adjusting your motorway cruise speed to see the real saving for your specific vehicle. For your full vehicle running cost per mile including fuel at different speed profiles, use ourcost per mile calculator.
Methodology
Speed vs fuel economy data is sourced from Argonne National Laboratory Autonomie model results published by the U.S. Alternative Fuels Data Center (June 2026), DOE fueleconomy.gov speed and fuel economy guidance, and EPA fuel economy testing data. The DOE $0.34 per gallon per 5 mph figure is from fueleconomy.gov. Fuel cost uses $4.07 per gallon from Consumer Reports June Speed vs MPG table values are illustrative estimates based on Argonne modelling and EPA trends. Actual MPG varies by vehicle make, tyre type, road gradient, and atmospheric conditions. Journey time calculations assume constant speed on flat road.