What Is Good Fuel Economy? Average MPG by Car Type 2026
What Is Good Fuel Economy?
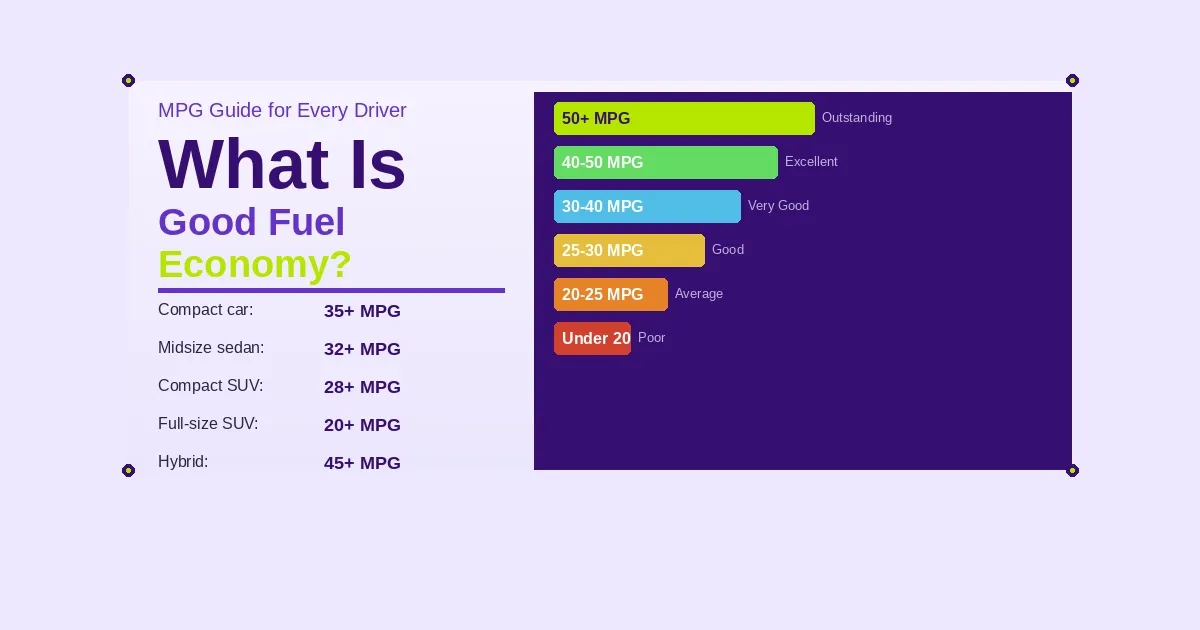
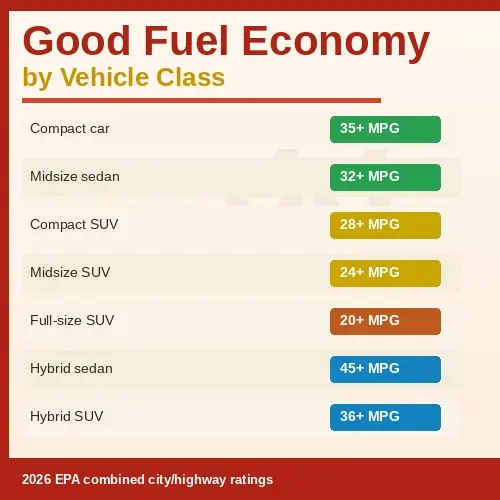
Compact car: 35+ MPG
Midsize sedan: 32+ MPG
Compact SUV: 28+ MPG
Full-size SUV: 20+ MPG
Hybrid: 45+ MPG
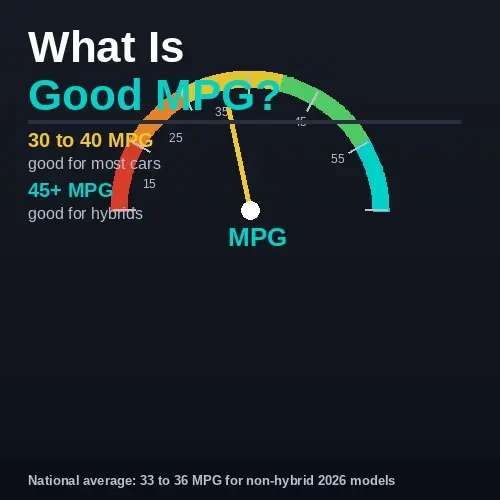
For most drivers, 30 to 40 MPG is considered good fuel economy.
Many drivers know their vehicle’s MPG figure but have no idea whether it is actually good or bad. A rating that looks impressive on a truck may be poor for a compact car. Understanding what is good fuel economy helps you compare vehicles, stimate fuel costs, and identify whether your car is performing as expected.
A good fuel economy for most cars in 2026 is 30 to 40 MPG combined city and highway driving. Hybrid vehicles usually achieve 40 to 57 MPG. Large SUVs and trucks average 15 to 22 MPG, where anything above 20 MPG counts as good for hat vehicle class. What counts as good depends entirely on the vehicle category you are comparing.
According to EPA fuel economy data, the national average fuel economy for new vehicles sold in 2026 sits around 33 to 36 MPG for non-hybrid models. According to NHTSA CAFE standards, the federal fleet average target for 2026 is approximately 49 MPG across the full fleet including hybrids and EVs.
Use our MPG calculator to find your exact fuel economy and compare it against the benchmarks in this guide.
Quick Answer: According to EPA fueleconomy.gov ratings, a good fuel economy for most cars in 2026 is between 30 and 40 MPG. Hybrid vehicles usually achieve 40 to 57 MPG while large trucks often average 15 to 22 MPG.
What Counts as Good Fuel Economy
Good fuel economy is relative to vehicle class, not a single fixed number. A 25 MPG rating is poor for a compact car but excellent for a full-size pickup truck. According to EPA fuel economy testing standards, every new vehicle receives three ratings: city MPG (simulating frequent stops and lower speeds), highway MPG (steady speed driving), and combined MPG, which weights city driving at 55 percent and highway at 45 percent.
EPA Combined Rating Explained
The combined MPG figure on every new car’s fuel economy label is the number most relevant for comparison. It reflects typical mixed driving rather than best-case highway-only figures.
Why Good MPG Is Relative to Vehicle Class
A small hatchback rated at 32 MPG is below average for its class. A full-size truck rated at 20 MPG is well above average for trucks. Comparing MPG across vehicle classes without adjusting for size and purpose gives a misleading picture.
MPG Rating Classification
For a quick answer to questions like “is 25 MPG good” or “is 35 MPG good,” the table below classifies any MPG figure on a general scale, regardless of vehicle class. Use this for a fast check, then refer to the class-specific table below for a more accurate comparison.
Quick MPG Classification
| MPG Rating | Classification |
| Under 20 MPG | Poor |
| 20 to 25 MPG | Average |
| 25 to 30 MPG | Good |
| 30 to 40 MPG | Very Good |
| 40 to 50 MPG | Excellent |
| 50+ MPG | Outstanding |
This general scale works well for cars and compact SUVs. Trucks and large SUVs should be judged against the class-specific table in the next section since their typical range sits lower across the board.
Average MPG by Vehicle Type
The table below shows combined MPG benchmarks for good, average, and poor fuel economy within each major vehicle class for 2026.
MPG BY CLASS TABLE
| Vehicle Class | Good MPG | Average MPG | Poor MPG |
| Compact car | 35+ | 30 to 34 | Under 28 |
| Midsize sedan | 32+ | 27 to 31 | Under 25 |
| Compact SUV | 28+ | 24 to 27 | Under 22 |
| Midsize SUV | 24+ | 20 to 23 | Under 18 |
| Full-size SUV | 20+ | 16 to 19 | Under 15 |
| Pickup truck | 20+ | 16 to 19 | Under 15 |
| Hybrid sedan | 45+ | 37 to 44 | Under 35 |
| Hybrid SUV | 36+ | 30 to 35 | Under 28 |
Based on EPA combined city/highway ratings for 2026 model year vehicles.
Use our L/100km calculator to convert these figures for international comparison.
Most Fuel Efficient Cars in 2026
Current EPA ratings show hybrid models consistently rank among the most fuel-efficient options available. The most fuel-efficient non-hybrid cars top out around 35 to 38 MPG combined, while hybrids deliver 37 to 57 MPG.
Most Efficient Non-Hybrid Cars
Compact non-hybrid sedans from major manufacturers commonly reach 34 to 36 MPG combined in their most efficient trims. This represents the practical ceiling for conventional petrol engines without hybrid assistance.
Most Efficient Hybrid Vehicles
Hybrid models including the Toyota Prius, Honda Civic Hybrid, and Toyota Corolla Hybrid consistently rank among the most fuel-efficient options on the market, usually achieving 45 to 57 MPG combined depending on model and trim. Hybrid SUVs from Toyota and Honda commonly reach 38 to 40 MPG combined, well above conventional SUV averages.
For specific current-year model rankings, check EPA fueleconomy.gov directly since exact figures and available models change with each model year.
Why Real World MPG Is Lower Than EPA Ratings
EPA ratings come from controlled dynamometer testing under standardised laboratory conditions. Real-world driving differs in several ways that reduce fuel economy below the lab figure.
Cold starts use more fuel before the engine reaches operating temperature. Hills and terrain increase engine load beyond flat-road test conditions. Traffic and stop-start driving reduce average speed efficiency. Weather, particularly cold temperatures and headwinds, increases fuel consumption. Individual driving style, including acceleration and braking habits, varies fuel use meaningfully between drivers in the same vehicle.
A gap of 10 to 20 percent below the EPA combined rating is normal for most drivers and does not indicate a problem. A gap larger than 20 to 25 percent below rating may point to a maintenance issue such as underinflated tyres, a clogged air filter, or a faulty oxygen sensor.
MPG vs L/100km
Drivers in Europe, Canada, Australia, and many other countries measure fuel economy in litres per 100 kilometres (L/100km) rather than MPG. Unlike MPG, where a higher number means better efficiency, L/100km works in reverse: a lower number means better efficiency.
A vehicle rated at 35 MPG converts to approximately 6.7 L/100km. A vehicle rated at 50 MPG converts to approximately 4.7 L/100km. The conversion is not linear, so direct mental conversion between the two systems is unreliable without a calculator.
Use our L/100km calculator to convert any MPG figure accurately for comparison with international vehicles or fuel economy figures.
How Fuel Economy Affects Cost
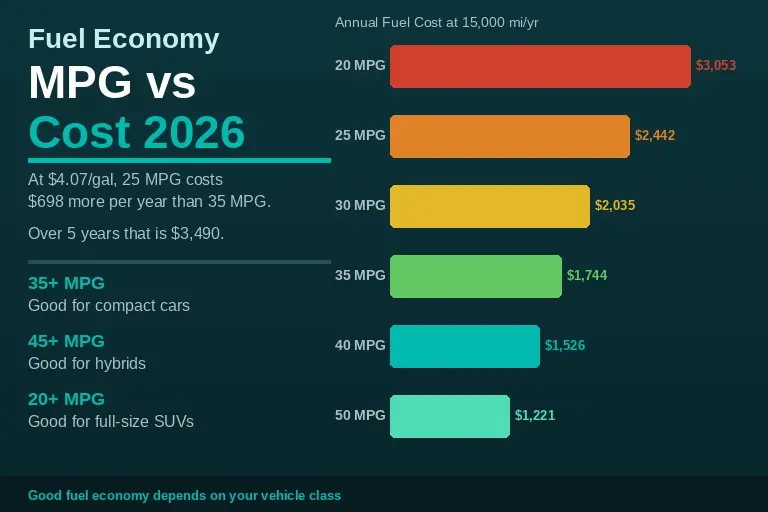
The practical reason fuel economy matters is cost. At $4.07 per gallon and 15,000 annual miles, the difference between good and poor MPG within the same vehicle class adds up meaningfully over time.
COST IMPACT TABLE
| MPG | Annual Fuel Cost (15,000 mi) | 5-Year Fuel Cost |
| 20 MPG | $3,053 | $15,265 |
| 25 MPG | $2,442 | $12,210 |
| 30 MPG | $2,035 | $10,175 |
| 35 MPG | $1,744 | $8,720 |
| 40 MPG | $1,526 | $7,630 |
| 50 MPG | $1,221 | $6,105 |
The gap between 25 MPG and 35 MPG saves $698 per year, or $3,490 over 5 years. Use our fuel cost calculator to calculate the exact annual cost difference between any two MPG figures at your mileage and local fuel price.
For total vehicle operating expenses beyond fuel, including insurance, maintenance, and depreciation, use our cost per mile calculator.
Frequently Asked Questions
Methodology
Vehicle class MPG benchmarks are sourced from EPA fueleconomy.gov 2026 ratings and the U.S. Department of Transportation 2026 Fuel Economy Guide. Fleet average target figures from NHTSA CAFE standards. Annual fuel cost calculations use $4.07 per gallon (Consumer Reports July 2026) and 15,000 annual miles. Actual fuel economy varies by driving conditions, climate, vehicle load, and maintenance condition.
This article was reviewed by the FuelConsumptionCalc Editorial Team and verified against official EPA fuel economy databases, NHTSA CAFE fuel economy standards, and Consumer Reports fuel cost data. Sources: EPA fueleconomy.gov 2026, NHTSA CAFE Standards, U.S. DOT 2026 Fuel Economy Guide, Consumer Reports July 2026.
Last Updated: July 2026.